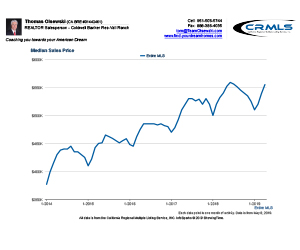


This is the Riverside County Real Estate Market Update. In this video I will show you what the real estate market is looking like as we enter the 4th quarter of 2022. Hi this is Tom Olsewski with Team Olsewski and Coldwell Banker and I want to continue to provide you with the most accurate information about our real estate market. These are real numbers not my opinion or information from a news update spreading negative information to help sell subscriptions.
Lets talk about active listings…… The active listing inventory increased by 152 homes, up 2%, and now sits at 6,250, its highest level of the year and the largest increase since the end of July. After 30-year mortgage rates dropped to 5% last month, they have climbed from 6% to 6.7% so far in September. These higher rates are further deteriorating home affordability, resulting in another drop in demand. Less demand has kept the inventory from dropping right now.
Even though Riverside County typically rises during the Autumn market and does not stop growing until Thanksgiving, but there are fewer homeowners coming on the market. Had it not been for drops in demand, the inventory would have already peaked. From here, expect the inventory to continue to slowly rise until peaking in November. The inventory will plunge to finish the year between Thanksgiving and New Year’s Day.
Now we will look at the demand. Demand, a snapshot of the number of new escrows over the prior month, decreased from 2,376 to 2,234 in the past couple of weeks, shedding 142 pending sales, or down 6%. It was the largest drop since mid-July. The high mortgage rate environment has dramatically impacted demand, dropping to levels not seen since the Great Recession. There are always buyers in every market, referred to as inherent demand, but expect demand levels to remain severely subdued. Mortgage rates are projected to remain above 6% for the remainder of the year. Demand will slowly drop from now until Thanksgiving. It will then plunge during the Holiday Market until ringing in a New Year.
Last year, demand was at 3,469, 55% more than today, or an extra 1,235. The 3-year average prior to COVID (2017 to 2019) was at 2,650 pending sales, 19% more than today, or an extra 416.
With supply rising and demand falling, the Expected Market Time (the number of days to sell all Riverside County listings at the current buying pace) increased from 77 to 84 days in the past couple of weeks, its highest level since April 2020. At 84 days, it remains a SlightSeller’s Market (60 to 90 days) where sellers get to call more of the shots, there are far fewer multiple offers and home values are not appreciating much at all. The market is no longer instant and properly pricing is crucial to find success, carefully considering location, condition, upgrades, and amenities. Last year the Expected Market Time was at 30 days, substantially faster than today. The 3-year average prior to COVID was at 95 days, a Balanced Market, and a bit slower than today.
So how is the Luxury market looking………. In the past two weeks the luxury inventory of homes priced above $800,000 increased by 38 homes, up 2%, and now sits at 1,441. Luxury demand plunged by 52 pending sales, down 14%, and now sits at 309. With supply rising and demand plunging, the overall Expected Market Time for luxury homes priced above $800,000 increased from 117 to 140 days, its highest level since June 2020. With the instability of Wall Street and stubbornly high rates, it appears as if the luxury market will continue to slow.
Year over year, luxury demand is down by 125 pending sales, or 29%, and the active luxury listing inventory is up by 671, or 87%. The Expected Market Time last year was at 53 days, considerably hotter than today.
For homes priced between $800,000 and $1 million, the Expected Market Time in the past two weeks increased from 101 to 122 days. For homes priced between $1 million and $1.5 million, the Expected Market Time decreased from 127 to 126 days. For homes priced above $1.5 million, the Expected Market Time increased from 145 to 222 days. At 222 days, a seller would be looking at placing their home into escrow around May 2023.
- For homes priced between $500,000 and $650,000, the Expected Market Time is 82 days, a Slight Seller’s Market. This range represents 30% of the active inventory and 31% of demand.
- For homes priced between $650,000 and $800,000, the Expected Market Time is 102 days, a Balanced Market (between 90 and 120 days). This range represents 20% of the active inventory and 16% of demand.
- For homes priced between $800,000 and $1 million, the Expected Market Time in the past two weeks increased from 101 to 122 days. For homes priced between $1 million and $1.5 million, the Expected Market Time decreased from 127 to 126 days. For homes priced above $1.5 million, the Expected Market Time increased from 145 to 222 days.
- The luxury end, all homes above $800,000, accounts for 23% of the inventory and 13% of demand.
- Distressed homes, both short sales and foreclosures combined, made up only 0.5% of all listings and 0.3% of demand. There are only 25 foreclosures and 9 short sales available to purchase today in all Riverside County, 34 total distressed homes on the active market, up 6 from two weeks ago. Last year there were 14 total distressed homes on the market, slightly fewer than today.
- There were 2,574 closed residential resales in August, down 22% over August 2021’s 3,328 closed sales. August marked a 9% increase from July 2022. The sales to list price ratio was 100.0% for Riverside County. Foreclosures accounted for just 0.3% of all closed sales, and short sales accounted for 0.1%. That means that 99.6% of all sales were good ol’ fashioned sellers with equity.
So overall we continue to move to a balanced market. The experts are not predicting a flood of foreclosures coming on the market that would push home values lower. If your looking to sell its important to price your home correctly you cannot price it to high as buyers have more choices to make. I will have separate videos for a couple of local area’s provideing more details on your local market overall. This is Tom Olsewski with Team Olsewski signing out and remember its important who you work with.